

Interagency Work Zone
Traffic Data Modeling and Analysis
NYU | Center for Urban Science and Progress
Capstone Project | 2020
Overview
Background
Road construction events are a necessary part of keeping road infrastructure in good condition but can pose significant safety problems when implemented. Temporary work zones for roadway constructions have the potential to significantly impact mobility and safety for all roadway users. An increase in the number of people using local streets because of work zone diversion plans may increase the likelihood of crashes, including crashes involving vulnerable populations (e.g., cyclists, seniors, and individuals with disabilities). To aid transportation authorities in the city of New York better understand the extent of mobility impacts associated with work zones, we propose a clustering approach to predict the probability of a vehicle collision occurring in the proximity of a road construction event (i.e. work zone).
Problem Statement
Can we use characteristics of streets and roadway construction events to predict collision probability in future work zones?
Scope

Data Wrangling

Clustering

Dashboard
Predictive Application
This project proposes using a k-means clustering approach to predict the probability of a vehicle collision occurring in the proximity of a work zone. The proposed clustering method is applied to over 20,000 construction and emergency construction events of relatively short duration in New York City to identify types of work zones that may present greater safety risks. The results of this project enables practitioners to employ appropriate mitigation strategies during project programming and develop effective transportation management plans.
Project Data
This project is unique in that all data sources used in this research are publicly available datasets. The team did not have access to a single, unified data source that provided information about the location and timing of construction work zones within NYC. Instead, the team brought together disparate datasets to produce an approximation of work zone events and their attributes (road type, duration, length, etc.). The information below shows the sources and features taken from each dataset to produce a single dataset of construction events.

511 Events
Geometry: Point- Location,
- Duration,
- Season

Street Closure
Geometry: Line- Length
Crash
Geometry: Point- Number of crashes

LION
Geometry: Line- Roadway type,
- Street width,
- Posted speed
Methodology
Data Wrangling
The data sources were produced by various entities and used different geometric representations. Therefore, there was a need for a standardized street network onto which data sets, namely LION, crashes, and work zones, could be joined. SharedStreets – a tool that creates a shared reference system for disparate street networks – provided a solution to connect the data. Each record in the LION, collisions and WZ data was assigned a ‘SharedStreets geometry id’. Based on this id, characteristics of streets, collisions, and work zones were linked. The data was filtered to include only durations less than 24 hours, and number of crashes happening within 900 feet of a work zone was calculated. Then the Street Closures data was joined to get the length attribute in feet.
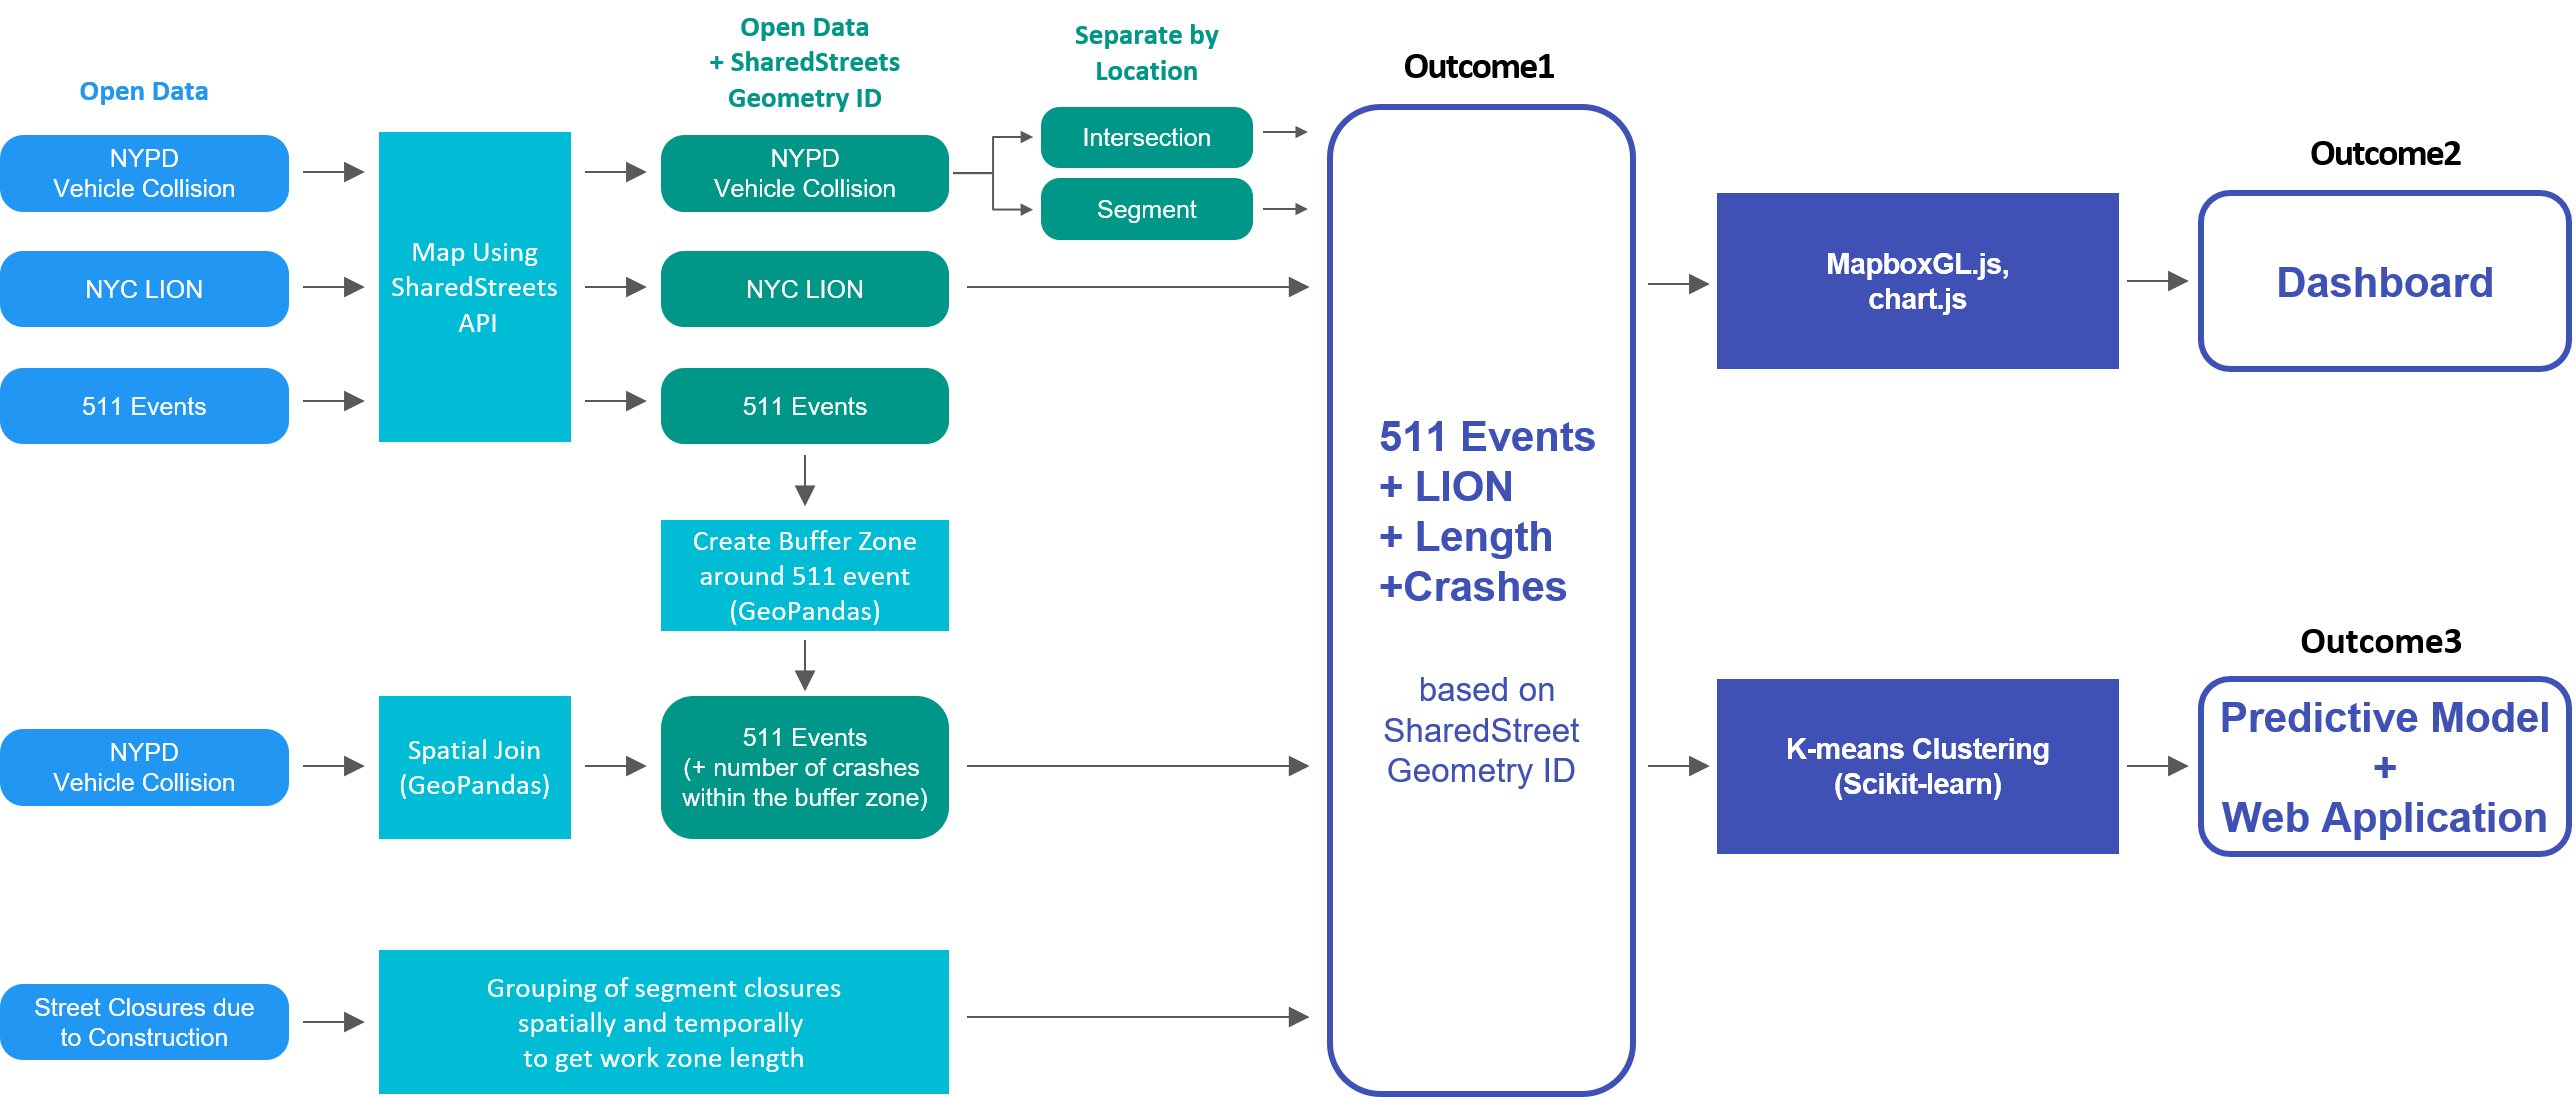
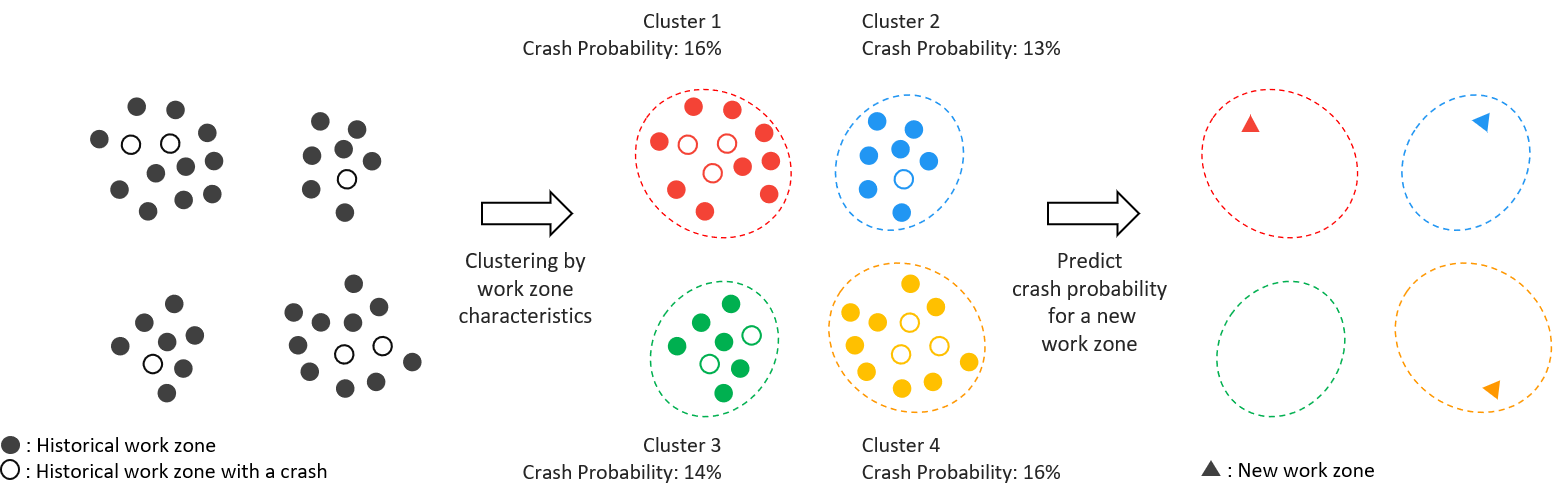
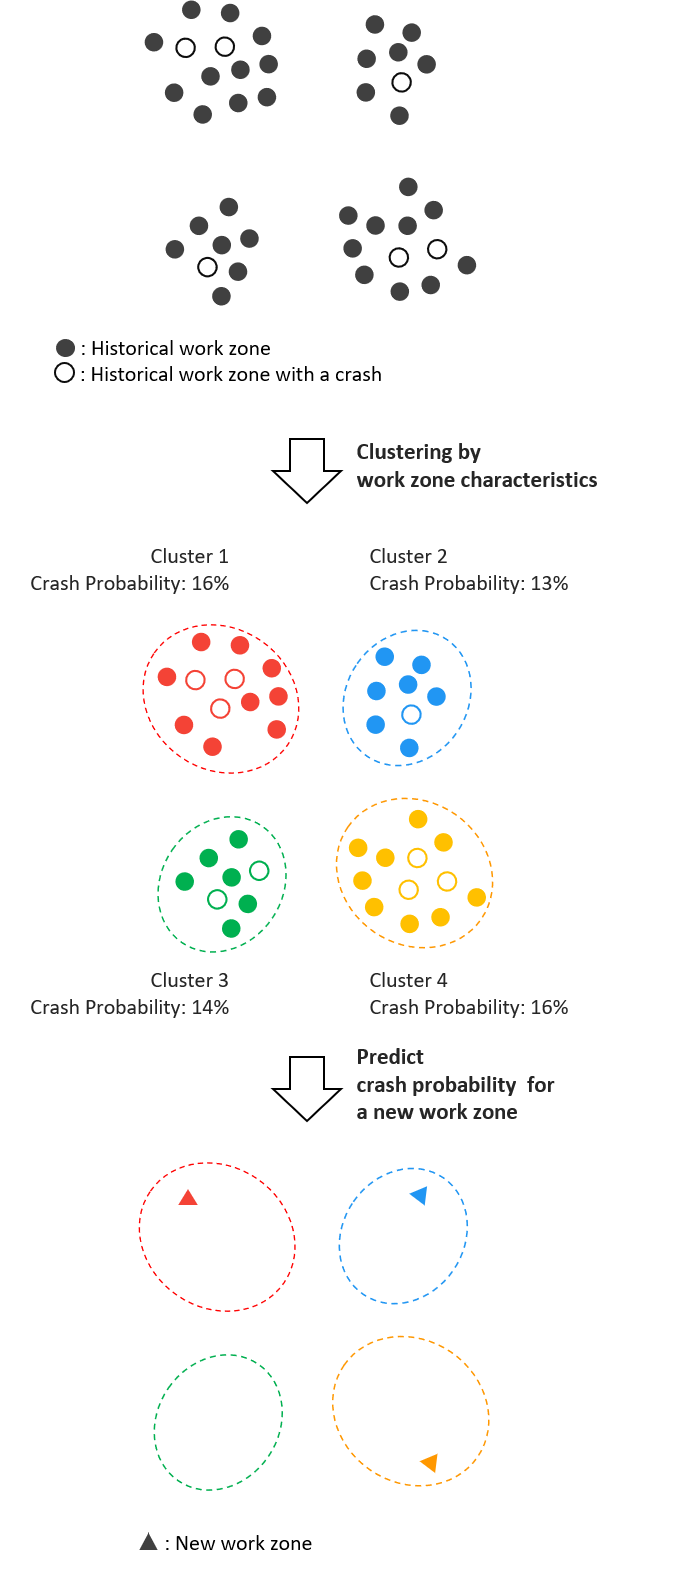
Clustering
With the spatial datasets wrangled into a common reference system, the team employed a k-means clustering algorithm. This approach was selected to provide a predictive framework to understand the probability of a crash occurring in the proximity of a work zone given certain characteristics. The clustering approach also provides the opportunity to identify different “cohorts” of work zones and identify work zones that may have a higher crash probability. Two separate clustering attempts were made – one with a larger dataset that did not contain a length attribute and one smaller subset of records that were able to be matched to permit data that contained a length attribute. The collision probability was then calculated by dividing the number of WZs witnessing a crash by the total number of WZs for each cluster.
Results
Clustering
The silhouette analysis was used to choose an optimal value for the number of clusters k=4. The predicted probability (using the train set) of a crash happening in each of the four clusters is 16%, 13%, 14%, and 16% respectively. An interactive dashboard was designed to serve as a tool for transportation authorities to explore the public safety risks associated with historical work events as well as the historical crash rates on all New York City roads and intersections. A predictive web application was also built off the results of the clustering methodology to inform the planning of multiple new construction events simultaneously. It would aid decision making to avoid situations with high crash risk.
Dashboard
Team
This project was completed as part of the 2020 Capstone process for the Center for Urban Science and Progress (CUSP) at NYU. The team would like to thank capstone sponsor HDR and their partners for their help in the execution of this research.
-
Collier, John


-
Han, Seunggyun
-
Jaber, Linda
-
Singh, Akhil
Mentors
-
Ozbay, Kaan
-
Khan, Junaid